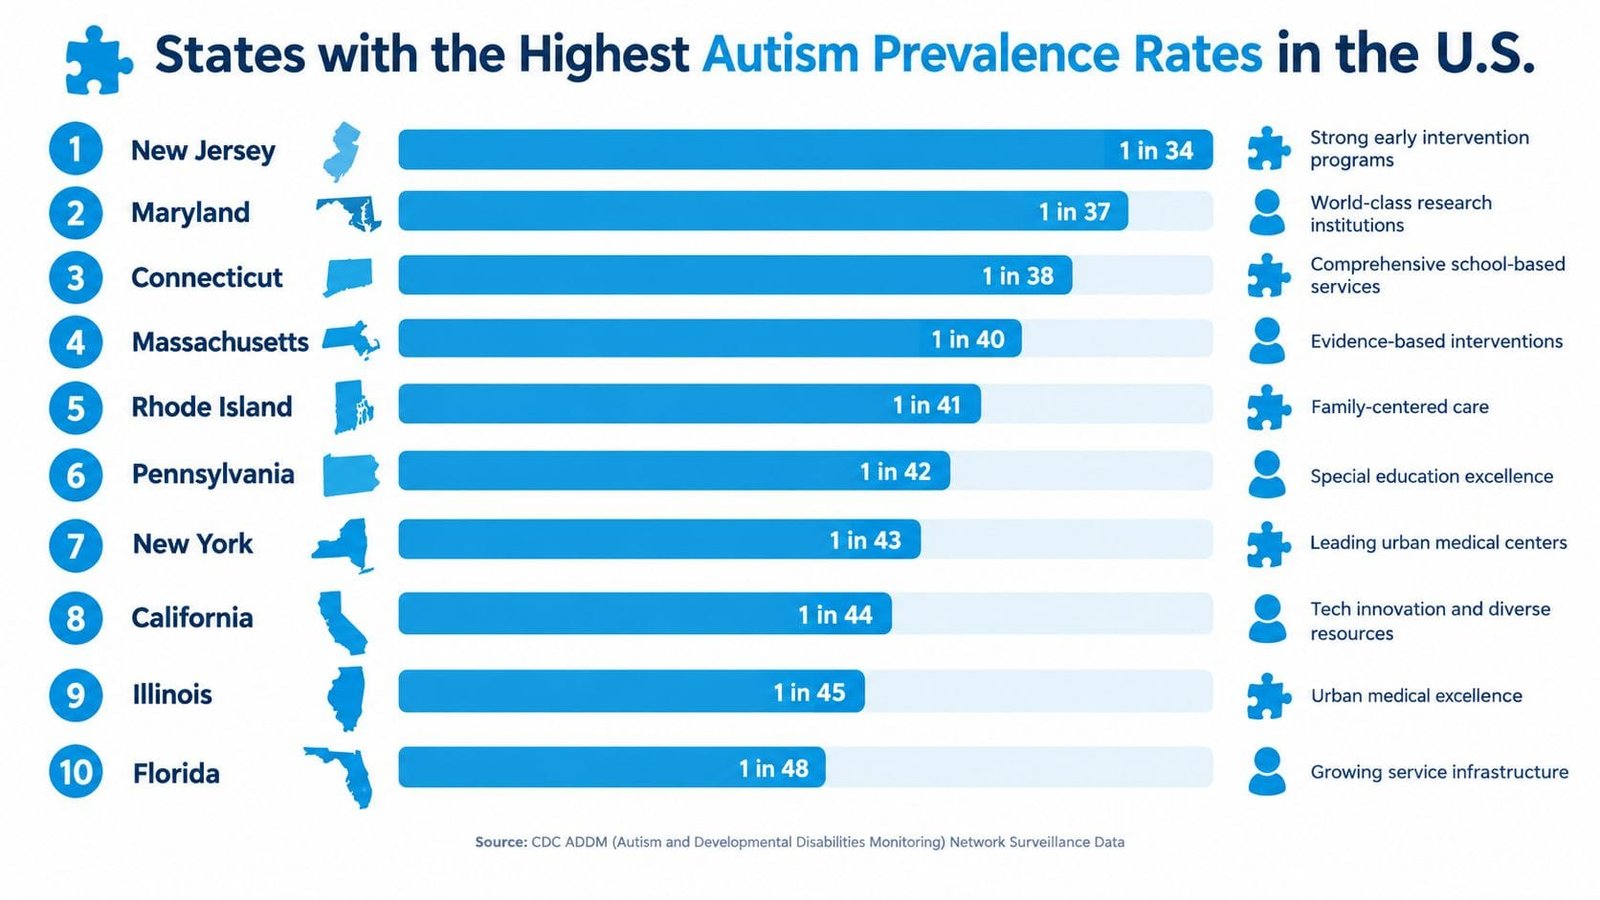
New Jersey is often presented as the state with the highest autism prevalence, with a supplied estimate of 1 in 34 children. Those figures are surveillance-based estimates, and higher identification does not by itself prove greater underlying autism prevalence.
The most defensible answer depends on which population, year, dataset, and surveillance method you mean. The CDC's 2022 ADDM Network report found that autism prevalence among 8-year-olds ranged from 9.7 per 1,000 in the Laredo, Texas, surveillance site to 53.1 per 1,000 in California, while the overall rate across the 16 monitored sites was 32.2 per 1,000, or 1 in 31 children (CDC surveillance report). Those are estimates from selected communities, not a uniform census of every child in every state.
That distinction changes how a “highest rate of autism by state” ranking should be read. A higher observed rate may reflect identification practices, screening access, referral patterns, diagnostic capacity, demographic composition, or how a surveillance system captures records. It shouldn't be treated as a league table of autism severity, family wellbeing, or service quality.
The state comparisons below use the supplied ordering as an editorial framework, but they avoid treating unsupported state ratios as verified national estimates. The practical question for caregivers is more useful: How can your family document needs clearly across home, school, therapy, and medical settings? Guiding Growth can help parents log observations, coordinate collaborators, and prepare exportable summaries. It doesn't diagnose autism, provide medical advice, or replace clinicians, educators, and care teams. Families looking for broader wellbeing resources can also explore InchBug mental health resources.
Table of Contents
- 1. New Jersey and the Limits of the Highest Ranking
- 2. Maryland and the Role of Diagnostic Capacity
- 3. Connecticut and Cross-Setting Information
- 4. Massachusetts and the Difference Between Identification and Outcomes
- 5. Rhode Island and Community Coordination
- 6. Pennsylvania and Educational Planning
- 7. New York and Uneven Access Across a Large State
- 8. California and the Importance of Surveillance Context
- 9. Illinois and the Urban-Rural Contrast
- 10. Florida and Continuity Through Changing Services
- Top 10 States by Autism Prevalence & Services
- Turn Prevalence Data Into Better Preparedness
1. New Jersey and the Limits of the Highest Ranking
New Jersey appears first in the supplied ranking, with a stated estimate of 1 in 34 children. That specific figure isn't included in the verified CDC data provided for this article, so it shouldn't be presented as an independently confirmed statewide estimate. The broader lesson remains important: a state can appear to have a high prevalence when families are more likely to reach screening, assessment, and educational identification systems.
A high observed rate may indicate that children with support needs are being recognized more consistently. It may also reflect differences in how records are collected and how children enter the surveillance sample. Those possibilities can coexist. A prevalence estimate tells you how many children were identified in a defined system, not why the rate differs or what services any individual child will receive.
Practical rule: Treat a state ranking as a prompt to investigate local access, not as a prediction about your child's needs.
For a New Jersey family, the most useful preparation is concrete documentation. Record developmental milestones, communication changes, sleep, meals, sensory responses, challenging behavior, and what happened immediately before and after an event. Voice logging can reduce the burden of writing notes after a difficult day. A parent can then review entries before a pediatric, therapy, or school meeting instead of relying on memory.
Guiding Growth's resources on financial planning for autism care can also help families organize questions about services and long-term planning. The app's summaries are organizational tools, not evidence that a particular intervention caused improvement.
2. Maryland and the Role of Diagnostic Capacity
Maryland ranks second in the supplied comparison, with an estimate of 1 in 37 children. That figure is supplied rather than confirmed by the verified dataset available here, so it should not be treated as a confirmed statewide CDC result. A high position may reflect differences in identification, screening, referral access, surveillance methods, and demographic patterns. It does not establish a higher underlying likelihood of autism, greater severity, or better family outcomes.
The practical question for Maryland families is whether evaluation and support pathways connect effectively. A child may be seen by a pediatrician, developmental specialist, school evaluation team, speech-language pathologist, occupational therapist, or behavioral provider. Each professional may observe a different setting. Maryland's service-system implication is the need for clear handoffs, so families should ask which records will be shared, who owns the next referral, and when follow-up will occur.
Families preparing for specialty or research appointments should separate clinical documentation from research evidence. A weekly record can list the date, setting, activity, communication, sensory response, sleep, and what happened before and after a behavior. Bringing the same summary to medical and education meetings can reveal patterns without presenting a parent's notes as a diagnostic test.
Families weighing different evaluation pathways can review how school vs. medical autism evaluations differ legally. The Autism Spectrum Quotient guide offers background on one screening instrument, but screening does not establish a diagnosis. Parents can ask the evaluating professional what the tool measures and what further assessment is required.
Guiding Growth can organize sleep, meals, therapy sessions, medication schedules, mood, and behavior context into shareable summaries. It is a tracking and coordination aid, not medical advice or proof that an intervention caused change.

3. Connecticut and Cross-Setting Information
Connecticut is listed third in the supplied comparison, with an estimate of 1 in 38 children. The verified data provided here don't include that state-specific figure, so it shouldn't be treated as a confirmed CDC statewide rate. The ranking does, however, raise a practical concern that applies everywhere: a child's functioning can look different at home, in school, and during clinical appointments.
A school team may observe transitions, group participation, classroom communication, and academic demands. Parents may see sleep disruption, sensory overload, feeding challenges, or difficult transitions in the evening. Therapists may focus on a narrower skill or treatment goal. None of those observations is automatically more complete than the others.
Families can create separate entries for each setting rather than combining every event into one general behavior note. Include the activity, people present, location, likely trigger, intensity, duration, and what helped. Over time, that structure may reveal that a behavior clusters around a particular transition or time of day. It may also show that a strategy works in one setting but needs adaptation in another.
A school meeting becomes more useful when everyone can distinguish a repeated pattern from one memorable incident.
Guiding Growth's IEP meeting preparation guide can help parents organize questions before an educational planning meeting. Its multiple child profiles and structured behavior fields can support separate records for home and school observations, while Smart Summaries can turn a chosen date range into a meeting-ready report.
Those reports should support discussion, not dictate an educational decision. The IEP team still needs to review evaluations, classroom data, teacher observations, family input, and the child's individual goals.
4. Massachusetts and the Difference Between Identification and Outcomes
The supplied list places Massachusetts fourth, with an estimate of 1 in 40 children. That ratio isn't included in the verified CDC evidence provided here, and it shouldn't be used as a confirmed state estimate. Even when a surveillance system records a high observed prevalence, the result doesn't tell families whether children have better outcomes or whether services are evenly available.
A state may have strong research and clinical institutions while still presenting uneven access by community, insurance status, transportation, provider availability, or family resources. Families shouldn't assume that a high ranking means every child can obtain timely evaluation or effective support.
The best use of a tracking system is to make intervention discussions more specific. Instead of recording only that a child had a “bad day,” note the demand, communication context, sensory conditions, sleep quality, meal pattern, and response from adults. If a family is trying speech therapy, occupational therapy, behavioral support, or another clinician-recommended approach, the log can show what changed around the same period. It can't prove causation, but it can give the care team a clearer starting point.
Guiding Growth supports structured entries for therapy, sleep, meals, mood, screen time, medications, and behavior. Its analytics can help parents inspect frequency, triggers, and time-of-day patterns. A parent can export a summary for a specialist and ask whether the pattern warrants further evaluation.
The key is restraint. A pattern in an app is a question for a qualified professional, not a diagnosis or a treatment conclusion.
5. Rhode Island and Community Coordination
Rhode Island appears fifth in the supplied ranking, with an estimate of 1 in 41 children. That state figure isn't present in the verified materials, so it shouldn't be presented as an established CDC statewide statistic. A ranking also can't show whether care coordination is working well for every family.
Smaller geographic areas may make communication between providers feel more manageable, but families still face practical friction. A pediatrician may not know what happened during therapy. A therapist may not see how sleep or school transitions affect the same behavior. A caregiver may notice a change but forget to report it during a short appointment.
Voice-first logging can help capture observations close to when they happen. A parent can describe the day naturally, review the extracted entries, correct mistakes, and save the record. That approach may be more realistic than expecting families to complete lengthy forms after work, school pickup, appointments, and bedtime.
Guiding Growth also allows parents to invite collaborators with different permissions. A co-parent, grandparent, therapist, or educator can contribute relevant information without taking over the child's entire profile. Shared access should still follow family preferences and professional privacy requirements.
Alma, the app's AI thinking partner, can help a parent formulate questions from logged information. It isn't a substitute for a clinician, and families shouldn't use it to make medical decisions. The strongest use is preparation: identify a recurring concern, collect examples, and bring a focused question to the care coordinator or provider.
6. Pennsylvania and Educational Planning
Pennsylvania is sixth in the supplied comparison, with an estimate of 1 in 42 children. That number isn't included in the verified CDC evidence supplied for this article, so it shouldn't be treated as a confirmed statewide prevalence estimate. It also shouldn't be confused with a measure of special education quality or a forecast of an individual student's school experience.
School planning works better when families describe both strengths and support needs. A child may communicate effectively about a preferred subject but struggle with unplanned changes. They may complete a familiar routine independently but need prompting when the setting changes. A single label can't capture those differences.
Parents preparing for school meetings can track observations across home, classroom, transportation, community activities, and therapy. Record the skill being attempted, the support provided, the child's response, and whether the result was consistent. That information can help the team discuss accommodations and goals in concrete terms.
Meeting preparation: Bring examples that show what the child can do, what interferes with participation, and which supports have already been tried.
Guiding Growth can organize these observations by child and setting. Its behavior analytics can help families identify recurring triggers, while exported summaries can give an Intermediate Unit or school team a concise view of the selected period. Parents should review every summary before sharing it and remove information that isn't relevant to the meeting.
Transition planning also benefits from longitudinal records. A child's needs can change as academic, social, vocational, and daily-living demands change. Consistent notes make it easier to explain the difference between a new challenge and a long-standing pattern.
7. New York and Uneven Access Across a Large State
New York is listed seventh, with a supplied estimate of 1 in 43 children. That ratio isn't included in the verified CDC sources provided here, so it shouldn't be treated as a confirmed statewide estimate. A single state figure can also conceal large differences between urban, suburban, and rural communities.
Families near major medical centers may have access to specialized evaluations that are harder to reach elsewhere. Travel time, appointment availability, insurance networks, and provider shortages can shape how quickly a child is assessed and supported. Those conditions can influence identification without proving that the underlying prevalence differs in the same way.
Parents navigating multiple providers should track what each professional recommended and what question remains unanswered. Include appointment dates, reported concerns, changes since the previous visit, and any follow-up required. Food, sleep, medication, and sensory observations may be relevant, but they should be presented as observations rather than conclusions about causation.
Guiding Growth can help families compare patterns across providers and time periods. A parent can attach notes, photos, or videos to an entry, then generate a report for a diagnostic appointment or school meeting. The purpose is to reduce scattered information, not to replace the clinician's evaluation.
For families moving between regions, exportable records can preserve continuity. A new provider can see the family's own account of routines and concerns instead of starting with a blank page. That record still needs to be interpreted alongside formal assessments and direct observation.
8. California and the Importance of Surveillance Context
California is eighth in the supplied list, with a stated estimate of 1 in 44 children, but the verified CDC surveillance data present a different and more nuanced picture. In the 2022 ADDM Network report, the California surveillance site recorded 53.1 per 1,000 8-year-olds, or about 5.3%, equivalent to 1 in 19, compared with 32.2 per 1,000, or 1 in 31, across the 16 monitored sites (CDC's 2022 ADDM findings). The result is a site-based estimate, not a single uniform rate for every California community.
California's observed rate was also 38.9 per 1,000 in 2018, the highest among the 11 states included in that year's CDC sample (CDC historical surveillance report). That repeated finding makes California important to the discussion, but it still doesn't establish why the rate is high or imply anything about the abilities or outcomes of autistic children.
The operational lesson is local. Families may encounter different school systems, regional centers, medical providers, insurance arrangements, and wait times depending on their county. A national ranking can't tell a parent which referral pathway is available nearby.
Guiding Growth can help families compare daily patterns while they manage different services. Food tracking, sleep records, structured behavior entries, and therapy notes can be reviewed together before a meeting. Families interested in research can export relevant information, but participation decisions and clinical interpretation belong with qualified professionals.

9. Illinois and the Urban-Rural Contrast
Illinois appears ninth in the supplied ranking, with an estimate of 1 in 45 children. That figure isn't included in the verified data provided here, so it shouldn't be stated as a confirmed statewide CDC rate. As with other large states, a single estimate may conceal differences in specialty access between metropolitan and rural areas.
A family near a major city may have more choices for developmental evaluation, therapy, and specialist consultation. That doesn't guarantee an appointment or affordable care. A family farther from those services may depend on school evaluations, primary care referrals, telehealth, or periodic long-distance visits. These pathways can generate different documentation trails.
Parents can prepare for a specialist by establishing a baseline before the appointment. Describe the child's usual communication, sleep, eating, sensory preferences, routines, and challenging situations. Then identify what changed, when it changed, and what adults tried. A concise timeline is often more useful than a large collection of disconnected anecdotes.
Guiding Growth can organize those baseline observations and create a summary for a medical or educational meeting. Families can filter entries by date range and event type, then review the report for accuracy. A report shouldn't be used to pressure a clinician toward a particular diagnosis or treatment. It should make the family's questions easier to understand.
The same information can support school coordination. If a specialist recommends a classroom accommodation, parents can bring that recommendation to the IEP team and discuss how it fits the child's educational needs.
10. Florida and Continuity Through Changing Services
Florida is tenth in the supplied list, with an estimate of 1 in 48 children. That number isn't part of the verified CDC evidence provided here, so it shouldn't be presented as a confirmed statewide estimate. A ranking also can't show whether a family can obtain timely services or maintain continuity as a child moves between systems.
Transitions can expose gaps in documentation. A child may move from early intervention to school services, change classrooms, switch therapists, or begin planning for adult supports. Each transition introduces new people who need to understand the child's communication, routines, preferences, and safety needs.
Families can make those changes easier by keeping a current profile. Record successful supports as well as difficult events. Include how the child communicates distress, what helps with recovery, which environments are challenging, and what independence looks like in daily routines. Grandparents and other caregivers may notice patterns that parents don't see, especially when they share regular care.
Guiding Growth's shared access allows approved collaborators to contribute observations. Multi-generational logging can preserve information from different homes and caregivers, while voice entries reduce the need for everyone to write notes in the same format. Parents should decide who can view or add information and should review entries for accuracy.
Florida's varied climate and outdoor settings may also create useful observation contexts. Families can note heat, crowds, water, clothing, noise, and schedule changes when those factors appear relevant. The record won't explain the behavior automatically, but it can help a care team ask better questions about environmental supports.
Top 10 States by Autism Prevalence & Services
| State (Prevalence) | 🔄 Implementation complexity | ⚡ Resource requirements | ⭐ Expected outcomes | 📊 Ideal use cases | 💡 Key advantages / tips |
|---|---|---|---|---|---|
| New Jersey (1 in 34) | High, coordinated mandates, many stakeholders | High funding, large therapist/specialist workforce | ⭐⭐⭐⭐, early ID and robust supports | Statewide early intervention models; intensive school-based care | Use shared-care summaries; document milestones; expect high demand |
| Maryland (1 in 37) | High, integrates advanced diagnostics & research | High, specialty centers and research infrastructure | ⭐⭐⭐⭐, accurate diagnosis, research access | Specialty referrals; clinical research participation | Share detailed logs with Hopkins/Krieger; leverage research opportunities |
| Connecticut (1 in 38) | Moderate, strong school–medical coordination | Moderate, well-funded schools, fewer private alternatives | ⭐⭐⭐, consistent school-based accommodations | IEP-driven services and school-centered screening | Track school vs home data; use reports for IEP meetings |
| Massachusetts (1 in 40) | High, research-led, evidence-based protocols | High, specialist costs and research resources | ⭐⭐⭐⭐, evidence-backed interventions, high clinical expertise | Families seeking research-backed therapies and high diagnostic certainty | Log intervention responses; prepare for specialist waitlists |
| Rhode Island (1 in 41) | Low–Moderate, small-state, centralized coordination | Moderate, accessible community services, limited specialists | ⭐⭐⭐, family-centered, responsive care | Coordinated family-centered early intervention | Use voice logging; share data with care coordinators |
| Pennsylvania (1 in 42) | Moderate–High, Intermediate Unit systems add layers | Moderate, strong schools but funding varies by district | ⭐⭐⭐, strong special education and transition planning | Long-term school planning and transition-age services | Track multi-setting progress; export longitudinal summaries |
| New York (1 in 43) | High, large, regionally variable system | High, urban specialist abundance, rural shortages | ⭐⭐⭐, excellent in urban centers, variable statewide | Urban specialist care; major medical referrals | Centralize data to navigate multiple providers; plan for costs |
| California (1 in 44) | High, diverse providers and county-level variation | High, many options, tech-enabled but uneven access | ⭐⭐⭐, potential via innovation; outcomes vary by county | Tech-enabled therapies and diverse intervention experimentation | Use analytics to compare options; leverage research centers |
| Illinois (1 in 45) | Moderate–High, expertise concentrated in Chicago | Moderate, strong metro resources, rural gaps | ⭐⭐⭐, high in metro areas, variable elsewhere | Metro-based specialist care and research referrals | Provide baseline logs before consults; adapt recommendations for rural settings |
| Florida (1 in 48) | Moderate, expanding infrastructure, uneven distribution | Moderate, growing services, regional variability | ⭐⭐, improving, strong focus on transition/adult services | Transition planning and culturally responsive programs | Document multi-generational care; track transitions and environment effects |
Turn Prevalence Data Into Better Preparedness
A ranking of the highest rate of autism by state is easy to share and difficult to interpret. The supplied state list presents ratios for New Jersey, Maryland, Connecticut, Massachusetts, Rhode Island, Pennsylvania, New York, California, Illinois, and Florida, but the verified evidence available here doesn't independently substantiate every ratio in that list. That limitation matters. Readers shouldn't mistake a supplied comparison for a complete, nationally comparable CDC ranking.
The strongest verified finding is more specific. In the CDC's 2022 ADDM Network surveillance, estimates among 8-year-olds varied from 9.7 per 1,000 in the Laredo, Texas, site to 53.1 per 1,000 in the California site, with 32.2 per 1,000, or 1 in 31, across the 16 monitored sites (CDC data on autism prevalence). The CDC's earlier surveillance also recorded California at 38.9 per 1,000 in 2018, while the 11-site average was 23.0 per 1,000, or 1 in 44. Those figures describe observed prevalence within surveillance systems. They don't measure autism severity, family outcomes, or the quality of every local service network.
The adult question produces a different kind of comparison. CDC state-estimate materials placed estimated autism prevalence among U.S. adults aged 18 and older at about 2.21% in 2017, ranging from 1.97% in Louisiana to 2.42% in Massachusetts (published adult state estimates). Comparing those estimates with child surveillance data would mix populations and methodologies.
Caregivers can turn this uncertainty into a practical plan:
- Verify the source: Ask whether a statistic comes from an ADDM surveillance site, administrative records, a survey, or a model-based estimate.
- Ask about local access: Discuss referral times, evaluation pathways, school supports, and provider availability in your community.
- Track across settings: Record observations from home, school, therapy, and community activities rather than relying on one environment.
- Bring focused questions: Share patterns with the child's pediatrician, clinicians, educators, and care coordinators, while letting qualified professionals interpret them.
- Protect the child's context: Avoid using prevalence rankings to make assumptions about ability, behavior, prognosis, or family experience.
Guiding Growth can be one optional way to organize that information. Its voice logging captures daily observations and turns them into structured entries. Families can track behavior triggers, intensity, duration, sleep, meals, mood, medications, therapy, and specialist visits. Analytics can help parents inspect patterns over time, while shared care-team access can keep approved collaborators aligned.
Smart Summaries can prepare selected information for a doctor visit, therapy session, or IEP meeting. Parents should review every report before sharing it and remember that the app doesn't provide medical advice or replace a qualified care team. For additional practical ideas, families can read about supporting autistic students at home.
The most useful next step isn't deciding which state “wins” the ranking. It's checking the methodology, asking how local systems affect your child, and maintaining consistent observations that help the people supporting your family respond to real needs.
Guiding Growth gives parents a place to log voice observations, track behavior, sleep, meals, therapy, and medications, share selected information with collaborators, and create meeting-ready summaries. Visit Guiding Growth to organize the patterns behind your child's care and prepare more clearly for medical, therapy, and school conversations.