By late afternoon, your notes may already be scattered across a fridge, a phone reminder, a school message, and a page of hurried tallies. Each record describes the same meltdown, but none gives you enough context to answer the question you're carrying into the evening: what is making this happen, and what might help next time?
Behavior charts for autism can bring those fragments into one usable picture. They aren't grades for your child, and they aren't a test of whether you're parenting correctly. Used carefully, they're a shared thinking tool that helps parents, educators, therapists, and clinicians notice patterns without relying on exhausted memory.
Table of Contents
- What Behavior Charts for Autism Really Do
- The Building Blocks Inside Every Behavior Chart
- Types of Behavior Charts and When to Use Each
- Designing a Chart That Reveals Patterns
- Reading Charts for Triggers, Clusters, and Trends
- Turning Paper Charts Into Insights With Guiding Growth
- Common Mistakes and a Simple Starting Plan
- FAQs About Behavior Charts and Tracking Apps
What Behavior Charts for Autism Really Do
A parent gets home, starts dinner, and notices a half-finished note on the refrigerator. It says, “Big meltdown after school.” A phone reminder says, “Ask teacher about transition.” Beside the sink sits a scribbled tally with no date attached. All three notes matter, but by the end of a demanding week, they're difficult to compare.
That's where a behavior chart for autism earns its place. It records one observable behavior, the situation around it, and what happened afterward in a consistent format. Instead of asking, “Was this a bad day?” you can ask more useful questions:
- How often did the behavior occur?
- What usually happened just before it?
- What followed the behavior?
Suppose your child drops to the floor during transitions. “Had a meltdown” is understandable family language, but it doesn't tell another adult what to look for. A more useful target might be, “Lies on the floor, cries loudly, and pushes away offered help.” The chart can then show whether this occurs after school, before dinner, during a change in plans, or when a particular demand is introduced.
The chart isn't judging the child. It's helping the adults see the situation more clearly.
The visual logic behind many behavior-tracking systems has a long history. Ogden Lindsley began using frequency-based monitoring of human behavior in 1952 and adapted semi-logarithmic charts by May 1955. The standard behavior chart was formalized in the late 1960s, and the name “standard behavior chart” was used from December 1967 until at least 1972, according to this history of precision teaching and behavior charting. Lindsley's work also included children with autism, which helps explain why repeated behavior, rate, and change over time remain central to many autism-tracking approaches.
The point isn't to create a perfect record. A useful chart replaces scattered impressions with information that different people can read, discuss, and act on together.
The Building Blocks Inside Every Behavior Chart
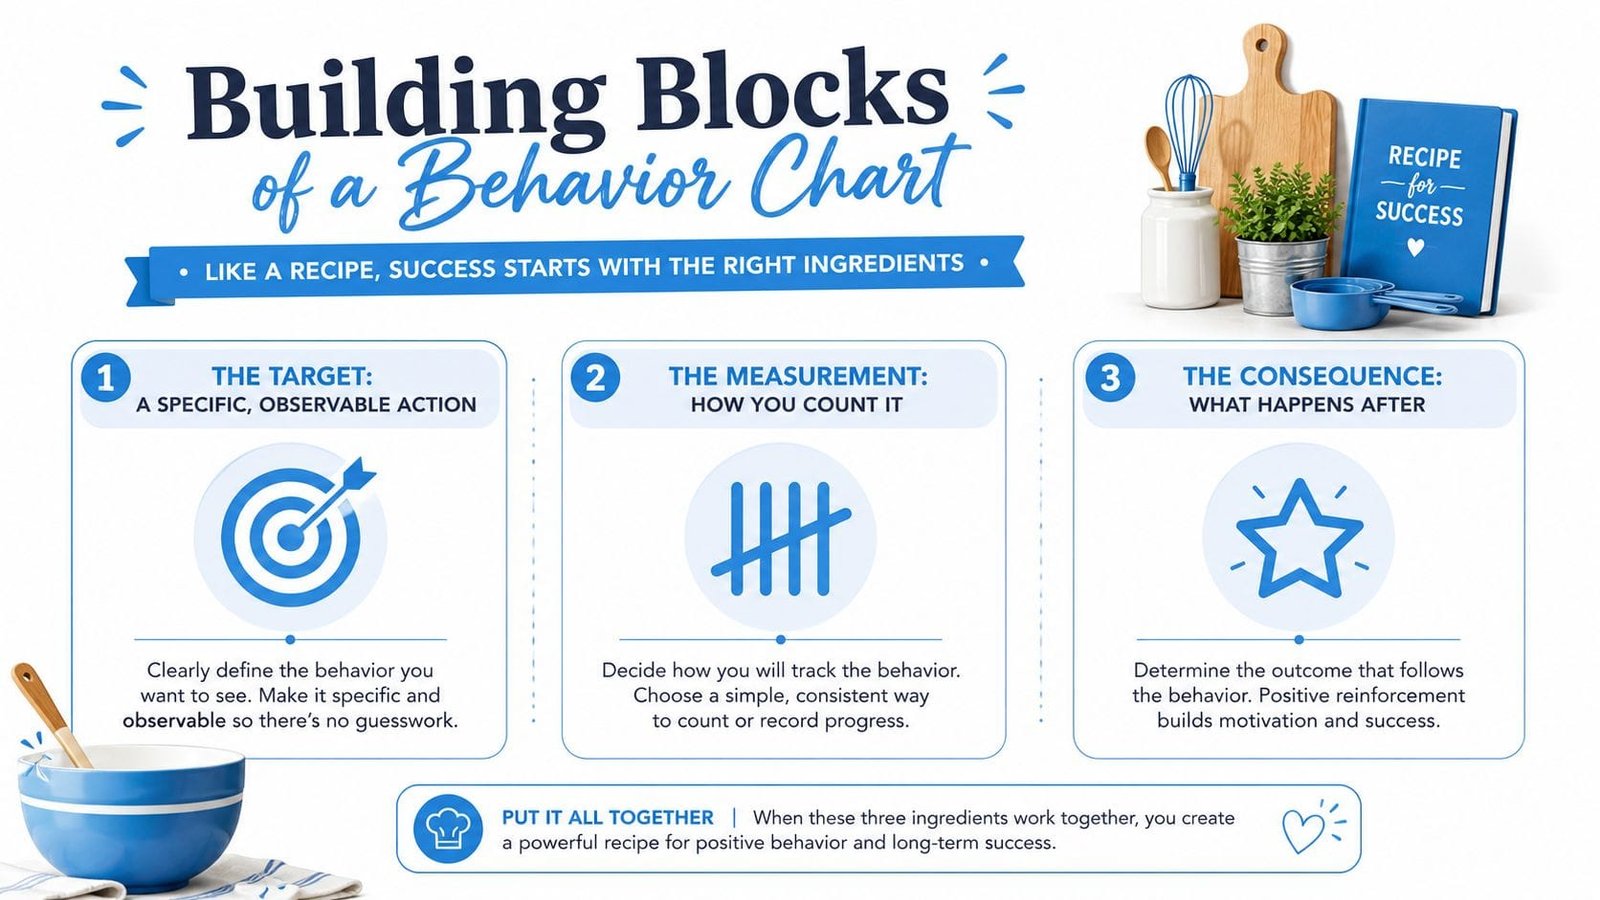
Every behavior chart shares the same core components, regardless of format. Choose one observable action, record what surrounds it, and measure it consistently. This structure helps a paper form or an app such as Guiding Growth reveal patterns instead of collecting disconnected notes.
Start with the target
Choose one action you can see or hear. “Hits the table with an open hand” is observable. “Is aggressive” is an interpretation that may mean different things to different adults. A narrow target makes entries more reliable and keeps the chart from becoming a general record of everything difficult.
Add the ABC frame
The ABC structure stands for:
- Antecedent: What happened immediately before?
- Behavior: What exactly did the child do?
- Consequence: What did adults, peers, or the environment do immediately afterward?
A consequence is not necessarily a punishment. The demand may have been removed, a snack offered, a sibling moved away, or comfort provided. Recording these details helps the team consider what the behavior may be communicating or achieving.
Measure what changes
Add a measurement layer:
- Frequency: How many times did it happen?
- Duration: How long did each episode last?
- Intensity: How serious was it, using a clear scale such as 1 to 3?
For example, intensity 1 might describe a brief action with no injury or disruption. Intensity 2 might require adult support, while intensity 3 might involve immediate safety concerns. Define the scale before you begin so the numbers carry the same meaning across days and between adults.
These building blocks work on paper or in a digital tracker such as Guiding Growth. In an app, consistent entries can be grouped to show recurring times, settings, or responses. That pattern-finding is the practical goal: the chart should help adults decide what to examine next, not merely document what happened.
If you are also reviewing daily living and adaptive skills, an ABAS-3 practical skills assessment can provide a broader view than a behavior chart alone.
Keep this short checklist where caregivers can see it:
- Name one visible action.
- Record what came before and after.
- Measure frequency, duration, or intensity consistently.
- Write facts first, interpretations later.
Types of Behavior Charts and When to Use Each
Parents often reach for a familiar chart even when it doesn't match the question. A sticker board may motivate a child to practice a skill, but it won't explain why a behavior appeared. An ABC log may reveal a trigger, but it may be too cumbersome for quick daily monitoring.
| Chart Type | Primary Purpose | Best Fit When |
|---|---|---|
| ABC data chart | Investigating triggers and possible function | A behavior is new, intense, or worsening |
| Token board | Teaching and motivating a defined skill | A child understands the earning system and can work toward a meaningful reward |
| Behavior contingency map | Showing choices and their outcomes visually | A child benefits from seeing what follows each choice |
| Visual schedule | Preventing uncertainty and supporting transitions | Changes in routine or unclear expectations often lead to distress |
| Standard frequency chart | Monitoring change over time | You need to know whether a target is increasing, decreasing, or staying stable |
ABC data charts are investigation tools. They help you examine whether a demand, transition, sensory event, or social interaction repeatedly comes before the behavior. They can suggest a hypothesis, but they don't prove the cause by themselves.
Token boards are teaching tools. A child earns tokens for a defined action, such as beginning a task or requesting a break, and exchanges them for a chosen item or activity. They're less useful when the target is vague or when the reward is unrelated to the child's interests.
Behavior contingency maps place choices and outcomes side by side. A positive choice can lead to a desired item, person, or activity, while another choice may lead to a consequence. Behavior contingency maps can make results easier to understand, but they shouldn't replace communication support or function-based planning.
Visual schedules are prevention tools, not punishment systems. A review identified 31 studies of visual activity schedules for students with ASD, with 16 meeting acceptable quality criteria, and concluded that visual activity schedules can be considered an evidence-based practice when paired with systematic instruction. You can explore practical examples in this visual behavior chart for autism resource.
A standard frequency chart answers a simpler question: “Is this happening more, less, or about the same?” Matching the chart to the question keeps tracking manageable.
Designing a Chart That Reveals Patterns
A revealing chart starts with one deliberate choice: define the target behavior clearly on day one. Choose an action you can record without guessing what the child feels or intends. “Hits head with an open hand” gives adults something concrete to track. “Meltdown” may describe a full episode, combining crying, dropping, hitting, running, and recovery under one label.
Choose context columns that earn their space
Begin with a small set of fields:
- Date and time
- Location
- People present
- What happened just before
- What followed
- Duration and intensity
A chart must fit family life. If completing it takes so long that nobody uses it, the extra detail has no value. Keep the core fields stable, then add a note when an unusual event may matter.
Compare two records of the same event.
Without context: “Meltdown after school.”
With context: “3:40 p.m., front hallway, parent and sibling present. School bus arrived late, then sibling entered the hallway loudly. Child covered ears, cried, and dropped to the floor for six minutes. Parent moved sibling away and offered headphones. Child stood after two minutes and walked to the quiet room.”
The longer entry does not prove the reason. It records a possible relationship among arrival time, noise, sensory support, and recovery. Repeated entries can show whether that relationship deserves closer attention. This is also the kind of structured detail an app such as Guiding Growth can compare digitally, helping parents design a chart around the patterns they want to see rather than collecting ABC notes.
Keep the layout predictable
Use the same columns on paper or in an app. If “intensity 2” means “needed adult help” this week, keep that meaning next week. Changing it to “lasted more than five minutes” makes comparisons unreliable.
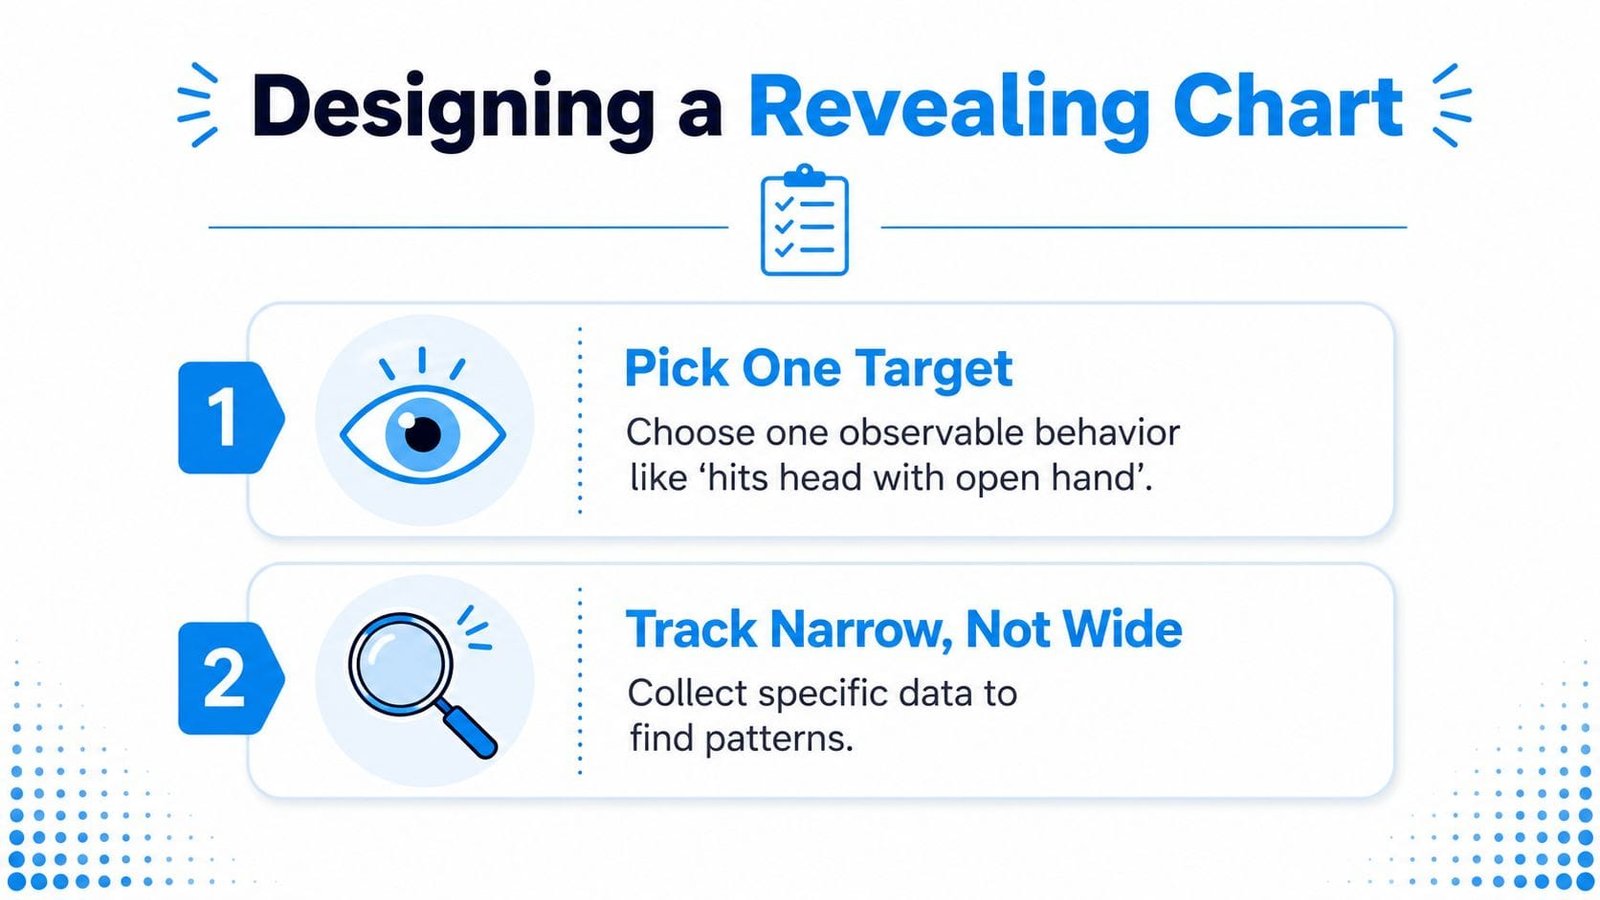
The chart should support daily life, not take it over. If writing immediately after every event is unrealistic, record a short voice note or quick tally, then add detail when everyone is calm.
Reading Charts for Triggers, Clusters, and Trends
After several days, the chart becomes more than a diary. It becomes a way to compare moments that felt unrelated. Start with frequency. Count how often the target appears per day or week, then look for clustering around time, place, activity, or caregiver.
A pattern might look like this: the behavior occurs mostly during evening hygiene, rarely during play, and almost never when the child chooses the order of activities. That doesn't establish a cause, but it gives you a focused question. You might test whether a visual sequence, a shorter demand, a sensory adjustment, or a communication option changes the outcome.
ABC entries also help you follow a chain. The immediate antecedent may be “parent says it's time to brush teeth,” but earlier events may include a missed snack, a noisy sibling interaction, or a difficult homework task. The behavior may then lead to a postponed routine, which could unintentionally make escape from the demand more likely next time.
A chart narrows the question. It doesn't diagnose the answer.
Functional behavior assessment is widely described as an evidence-based way to connect direct observation with a hypothesis about function before choosing an intervention. The functional behavior assessment framework emphasizes concrete observation, antecedents, consequences, and measures such as frequency, duration, and intensity.
| What the chart can reveal | What the chart cannot reveal |
|---|---|
| Whether episodes cluster at a particular time | Whether the child is experiencing pain |
| Which settings or people are often present | Whether hunger, illness, or poor sleep is driving distress |
| What commonly happens immediately before | Whether medication effects or medical conditions are involved |
| What adults do afterward | The child's internal experience or intent |
| Whether a target changes after support is introduced | Whether a correlation proves the cause |
Include broader wellbeing information when it matters. Neutral autism guidance recommends checking whether a child is sick, tired, stressed, hungry, in pain, or responding to a change in routine, rather than treating every visible behavior as a standalone problem. Research on autism behavior measurement also supports looking beyond simple counts, including latency, time-based patterns, location, caregiver presence, and other context-sensitive indicators, as described in this research on objective behavior measurement.
Turning Paper Charts Into Insights With Guiding Growth
Paper charts preserve the moment. An app can connect moments that occur in different rooms, on different days, and with different caregivers. That distinction matters when one parent sees a behavior at breakfast, a teacher notices it during transitions, and a therapist sees something similar during a structured task.
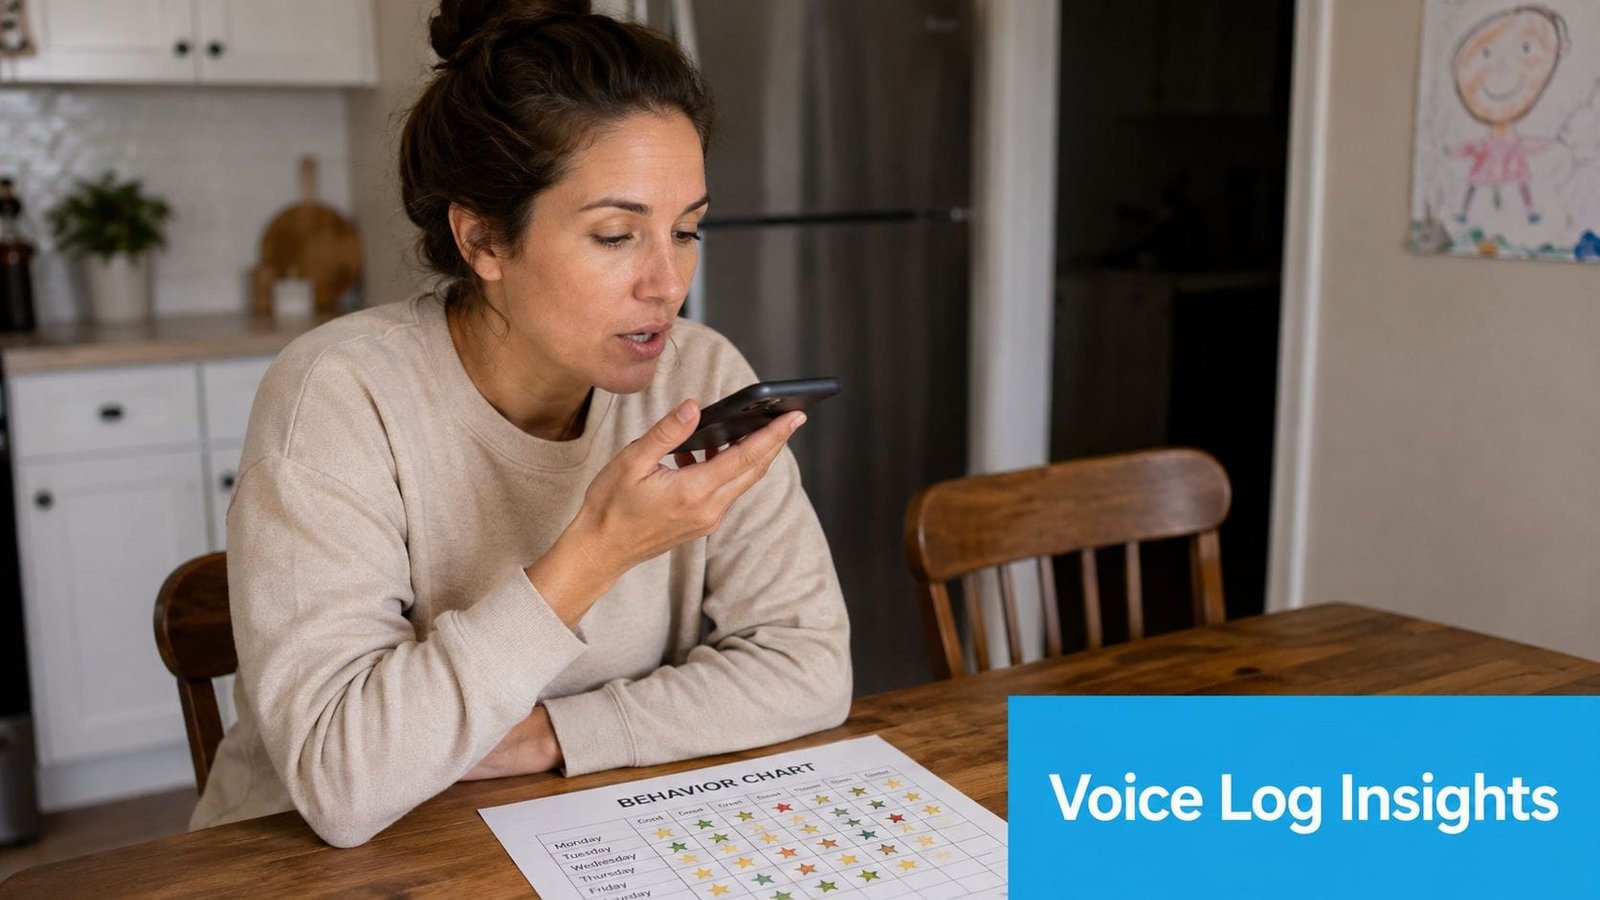
Guiding Growth is one option for organizing this information. Its behavior logging can capture an event, trigger, intensity, duration, and outcome, while voice logging can reduce the need to type during a busy evening. Shared timelines allow family members, caregivers, and professionals to contribute information rather than keeping separate notebooks that never meet.
From rows to visual patterns
A raw list may be accurate but difficult to scan. A dashboard can help organize entries into views such as:
- Frequency bars for changes across days or weeks
- Time-of-day patterns for recurring clusters
- Tagged antecedents for comparing common triggers
- Outcome notes for seeing what followed the behavior
Those displays don't replace careful interpretation. They make repeated relationships easier to notice without manually adding every tally.
Preparing for conversations
A concise export can help a parent bring organized information to an IEP meeting, therapy appointment, or medical visit. The team can review the target definition, the context, the outcome, and any changes that occurred during the tracking period.
The evidence base has already moved beyond paper-only recording. In a 2019 observational study, 144 caregivers used the My JAKE app for 8 to 10 weeks to report sleep quality, affect, and other self-selected behaviors, while comparison paper-and-pencil scales were collected every 4 weeks. A separate feasibility study enrolled 29 children and adolescents with ASD across 3 U.S. sites, showing that structured tracking tools have been tested in real clinical-research settings. A 2023 Nature Medicine study reported that combining M-CHAT-R/F with digital screening increased positive predictive value to 63.4%, as summarized in this review of caregiver reporting and digital behavioral phenotyping.
The practical advantage is not that digital tracking makes every interpretation correct. It's that shared, timestamped records can reduce the burden of remembering and make the same information visible to the people supporting your child.
Common Mistakes and a Simple Starting Plan
Tracking can fail subtly. A parent may record every episode but omit the setting, the demand, or what happened afterward. The chart then becomes a pile of numbers without a useful question attached.
Four habits that weaken the record
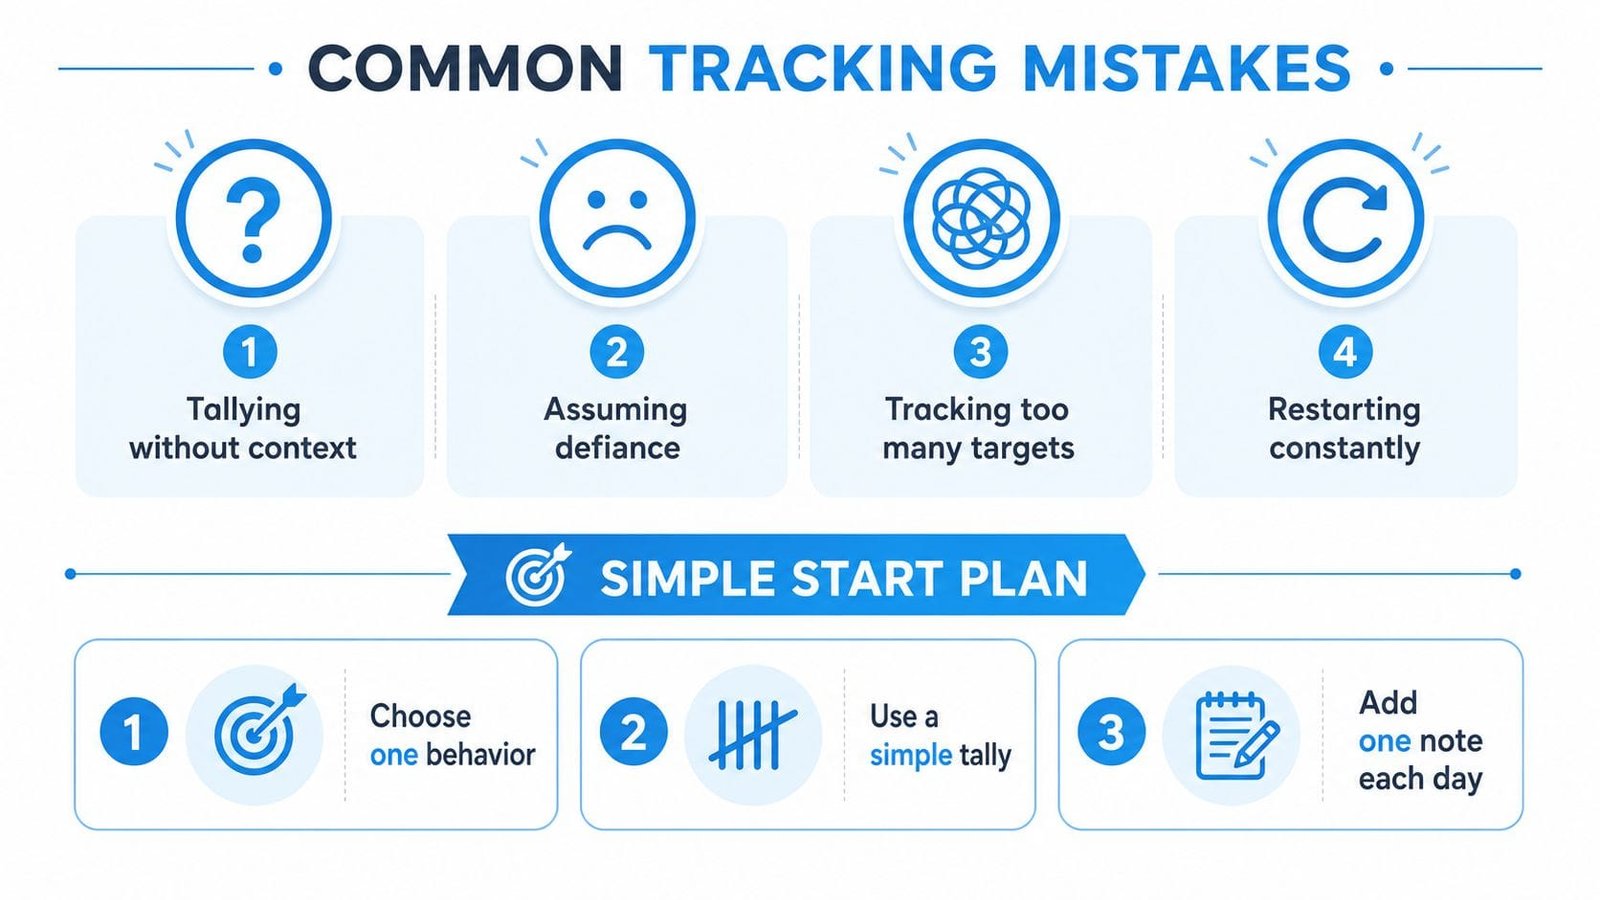
- Tallying without context: Add one short note about what happened before or after each meaningful event.
- Assuming defiance: Ask what the child may be communicating, avoiding, seeking, or struggling to tolerate.
- Tracking too many targets: Choose one behavior until your family understands the recording routine.
- Restarting constantly: Keep difficult days in the record. They may contain the most useful information.
Rewards also need care. A token board or contingency map should teach a clear skill or choice, not pressure a child into suppressing distress or staying silent. Public education guidance describes visual supports as tools that help students understand expectations and behavior at school and home, not merely as generic praise systems. You can review that autism classroom and home visual-support guidance when deciding whether a visual tool fits your child.
A manageable starting plan
Week one: Choose one observable target and use a simple tally. Write the date and time, but don't demand a perfect narrative during a crisis.
Week two: Continue the same target and add one daily note about setting, sleep, food, transition, or sensory context.
Weeks three and four: Add ABC details for episodes that matter most. Review the record on Sunday evening and look for clusters rather than isolated incidents.
Call a BCBA, therapist, or another qualified professional when self-injury is escalating, sleep loss is affecting the whole family, or four honest weeks of data show no meaningful progress. Seek medical, speech-language, occupational therapy, or school evaluation when the pattern suggests pain, communication barriers, sensory needs, or broader developmental concerns.
FAQs About Behavior Charts and Tracking Apps
Do behavior charts work beyond sticker motivation?
Yes, when the chart records observable behavior and context rather than only rewards. ABC logs and frequency records can support function-based conversations, while token boards and contingency maps serve different teaching purposes. The differences are covered in the behavior tracking app guide.
How young can a child be before tracking becomes stressful?
There's no single starting age. Adults can observe and record behavior without asking a young child to fill out a chart, and visual supports can be adapted to the child's communication style. Keep the process brief and focus on information that helps the child.
How long does it take to see patterns?
Patterns may become clearer after repeated entries across ordinary routines, but the useful timeframe depends on how often the behavior occurs and how consistent the context is. One autism-focused guide recommends tracking for 2 to 4 weeks so repeated influences such as sensory triggers, routine changes, hunger, and sleep-related discomfort can become more visible, as described in this ABC tracking guide.
What if both parents record the same event differently?
Agree on the target definition and intensity descriptions before tracking. Keep both observations when they differ, then discuss what each adult saw instead of choosing one account automatically.
Should I share raw logs with a therapist?
Share them when the therapist knows how you define the target and what each column means. A concise summary may be easier to review, but raw entries can preserve context that a weekly total hides.
How can an app keep entries private?
Review the app's privacy information, account controls, sharing settings, and export process before adding sensitive details. Share only what each caregiver or professional needs, and confirm who can access a shared timeline.
Guiding Growth lets families record behaviors, triggers, intensity, duration, routines, sleep, appointments, and related care details in one place, with voice logging and collaboration for people supporting the child. Visit Guiding Growth to turn scattered notes into an organized record you can review with your family and care team.