You're probably already doing behavioral data analysis, just without calling it that.
You notice your child melts down more often after a rushed morning. You remember that sleep was off the night before. You wonder whether a noisy store, a skipped snack, or a change in routine played a part. Then the day gets busy, the details blur, and by the time you're talking to a therapist or doctor, you're trying to rebuild the story from memory.
That's exhausting. It also makes patterns hard to trust.
Behavioral data analysis is the practice of turning those daily moments into usable information. Instead of relying on scattered notes or mental snapshots, you start collecting observations in a consistent way so you can see what repeats, what changes, and what helps. For parents of neurodivergent children, that can mean fewer guesses and clearer support.
Table of Contents
- What Is Behavioral Data and Why It Matters
- How to Collect Meaningful Behavioral Data
- Turning Observations into Measurable Insights
- Finding the Story in Your Child's Data
- How AI Can Enhance Your Understanding
- Sharing Data Ethically with Your Care Team
- Putting Your Data into Action with Guiding Growth
What Is Behavioral Data and Why It Matters
Behavioral data is the record of what happened, when it happened, and what was happening around it. For a parent, that might include a meltdown before school, a shutdown after a loud birthday party, echolalia during transitions, or hand flapping when excitement rises.
That sounds simple, but it changes everything. Once a behavior is recorded with context, it stops being a random event and starts becoming part of a pattern.
What counts as data
Many parents think data has to look technical. It doesn't. In real life, behavioral data can include:
- Triggers like noise, hunger, transitions, waiting, demands, or sensory overload
- Behaviors like crying, pacing, bolting, covering ears, repeating phrases, or going quiet
- Outcomes like leaving the room, getting comfort, stopping a task, or calming after a break
- Context such as time of day, location, who was present, food, sleep, or medication
A useful way to think about it is this. Your child's day is a story. Behavioral data analysis helps you stop relying on memory alone and start collecting the plot points.
Why analysis matters
A list of events by itself isn't enough. Analysis is what helps you summarize what you've seen and make sense of it. In behavioral science, that work rests on descriptive statistics such as mean, median, mode, variance, and standard deviation, and inferential statistics such as hypothesis testing, test statistics, p-values, ANOVA, and Chi-square tests. These methods help researchers summarize behavior and draw conclusions from samples to larger populations, often using tools like SPSS, R, and Python (basic statistics for behavioral sciences).
You don't need to become a statistician to benefit from that logic. The family version is much more practical. You're asking questions like: Does this behavior happen more in the evening? Does it show up after poor sleep? Does one routine lower stress while another seems to raise it?
Practical rule: Data doesn't replace your intuition. It gives your intuition something solid to stand on.
When parents track behaviors consistently, they often move from reacting in the moment to preparing ahead of time. That's where behavioral data analysis becomes more than a concept. It becomes a way to understand your child with more clarity and less self-doubt.
How to Collect Meaningful Behavioral Data
The best data collection method is the one you'll use on a hard day.
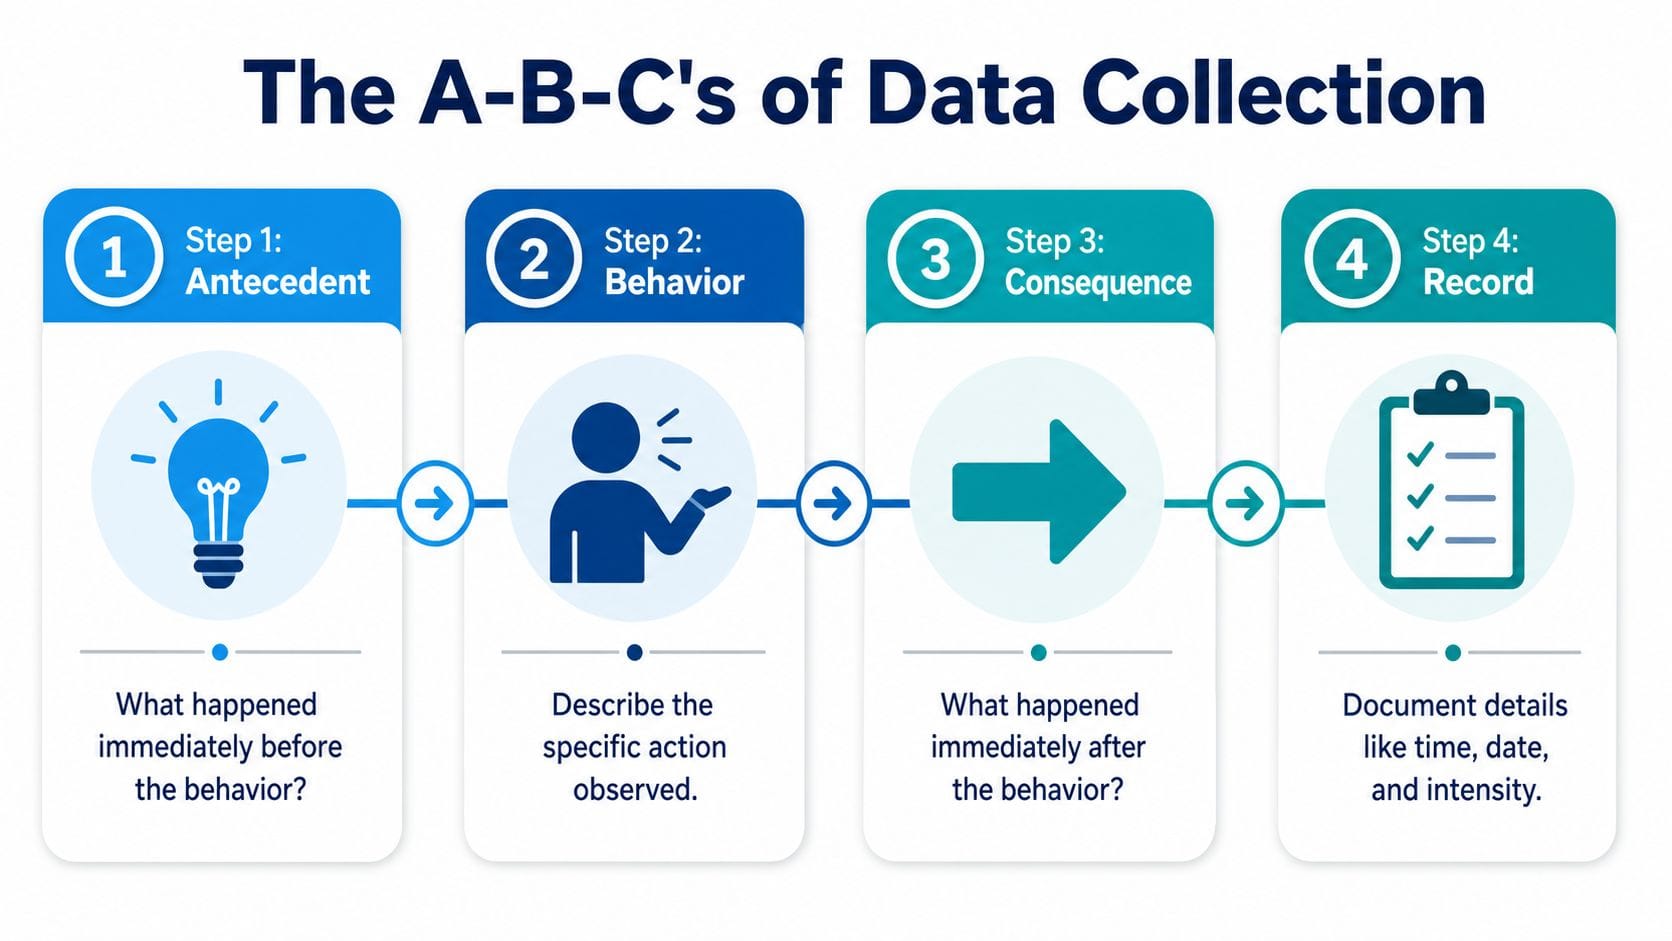
That's why many behavior specialists rely on the A-B-C model. It breaks one moment into three parts: Antecedent, Behavior, and Consequence. In plain language, that means what happened before, what your child did, and what happened right after.
Use the A-B-C lens
Here's how it looks in everyday life.
| Part | Simple question | Example |
|---|---|---|
| Antecedent | What happened right before? | Parent asked child to stop iPad and get shoes |
| Behavior | What did I observe? | Child screamed, dropped to floor, covered ears |
| Consequence | What happened right after? | Transition was delayed, parent offered a break |
This approach matters because it separates observation from interpretation. “My child was being difficult” is a feeling. “A transition demand was followed by screaming and dropping to the floor” is data you can work with.
Add the context that memory loses
Parents often remember the big behavior but lose the surrounding details. Those details are usually where the pattern lives.
Try to capture:
- Time because morning, after school, and bedtime can look very different
- Place because home, car, clinic, and store environments place different demands on a child
- People present because support, sibling conflict, or unfamiliar adults can change the situation
- Body factors like sleep, food, illness, medication, or sensory load
One useful method is scatterplot analytics, which matches a behavior to the exact time of day so families can spot temporal triggers that ordinary notes often miss (scatterplot analytics in ABA data collection).
If a behavior feels unpredictable, start by checking whether it's actually time-linked.
That insight is one reason structured logging tends to work better than a notebook full of mixed observations. A dedicated behavior tracking app for families can make those entries faster and more consistent because it prompts you to record the same key details each time.
Aim for consistent, not perfect
Many parents stop tracking because they think they need to capture everything. You don't.
A short, reliable log beats a detailed system you abandon after three days. If you only record one behavior this week, but you record it the same way each time, you've created something useful. Over time, those repeated snapshots form a timeline you can learn from.
A good test is whether another caregiver could read your note and picture the moment clearly. If they can, your entry is specific enough.
Turning Observations into Measurable Insights
Once you've collected a few entries, the next question is what to measure.
Three terms come up again and again in behavioral data analysis: frequency, duration, and intensity. They sound formal, but they're very human measures.
Frequency, duration, and intensity in plain language
Think of a thunderstorm.
Frequency is how many times the thunder claps.
Duration is how long the storm lasts.
Intensity is how strong the storm feels.
Behavior works the same way.
- Frequency asks how often something happens. How many times did your child leave the table during dinner?
- Duration asks how long it lasts. Was the shutdown brief, or did it stretch through most of the evening?
- Intensity asks how big it was. Did your child whimper, cry hard, throw objects, or need a long recovery period?
These measures matter because two days can look similar from memory but differ in important ways. A behavior that happens often for short periods may need a different response than a behavior that happens rarely but lasts a long time.
Small measurements reveal trends
In clinical behavior tracking, computerized systems can summarize data as average responses per minute or percentage of intervals. For neurodivergent behaviors such as meltdowns or echolalia, one technical approach uses 10-second intervals to capture cumulative responses. That level of timing can reveal clustering of triggers and outcomes that manual logging often misses (10-second interval behavioral tracking).
Most parents won't sit with a stopwatch and coded sheets all day. Still, the principle is useful. The more clearly you define what you're counting, the more trustworthy your pattern becomes.
Here's a simple guide:
- Use frequency for actions you can count, such as hitting, bolting, or repeated phrases
- Use duration for states that continue over time, such as crying, pacing, or withdrawal
- Use intensity when severity changes matter, such as mild protest versus severe distress
If you're also learning about therapy approaches connected to supporting child development, it helps to know that clear measurement is what turns a vague concern into something a care team can track together.
A structured functional behavior analysis example can also help parents see how these measurements fit into a bigger picture of triggers, responses, and support planning.
The point of measurement isn't to reduce your child to numbers. It's to notice change that your tired brain might miss.
Finding the Story in Your Child's Data
A page full of logs can still feel overwhelming. The shift happens when you start asking better questions.
Instead of “Why is this happening?” try questions that data can answer. Does the behavior happen more on school mornings? Does it show up after poor sleep? Is recovery faster when a visual warning comes before a transition?
Start with averages
One of the most useful tools is also the simplest. Look at the average.
If you track meltdowns for several weeks, an average can tell you what a typical week looks like. That doesn't solve every problem, but it gives you a baseline. Once you know the baseline, you can spot when things improve, worsen, or shift.
In formal terms, this is descriptive statistics doing its job. In parent terms, it answers, “What's normal for us right now?”
Use visuals to spot what prose hides
A chart often shows what a notebook conceals.
If you place behaviors on a calendar or timeline, patterns jump out. You may notice that shutdowns cluster after therapy days. You may see that demand avoidance spikes in the late afternoon. You may find that a rough bedtime often follows a specific combination of missed snack, noisy outing, and late transition home.
A timeline is powerful because behavior unfolds in sequence. It's not just what happened, but what happened first, second, and third.
Sometimes the answer isn't hidden. It's just buried in a format your eyes can't scan.
Look for connections, not blame
Pattern detection doesn't mean declaring a single cause after one hard day. It means noticing repeated relationships.
A few examples:
- Sleep and regulation might move together, with harder mornings after restless nights
- Transitions and distress might connect when demands come suddenly
- Environment and behavior might line up when certain stores, classrooms, or social settings overload your child
- Support and recovery might show that one calming strategy shortens recovery time more than another
This kind of analysis matters in long-term care. In one study on ABA intervention, continuous therapy was associated with a 4.46-point increase on the Aberrant Behavior Checklist for every 12 months of intervention, showing why steady tracking over time matters when families and clinicians want to judge progress carefully (ABA outcomes and the Aberrant Behavior Checklist).
Ask questions your data can actually answer
When parents get stuck, it's often because the question is too broad. “What's wrong?” is impossible to chart. Better questions are concrete and testable.
Try questions like these:
When is this most likely?
Morning, after school, bedtime, weekends, therapy days.What tends to come before it?
Waiting, noise, hunger, sibling conflict, transitions, denied access.What helps the recovery?
Space, movement, quiet, visual supports, snack, connection, reduced language.What changed recently?
Schedule, sleep, illness, medication, school demands, travel, new routines.
That's the story hidden inside behavioral data analysis. You aren't just counting hard moments. You're learning what your child may be communicating through behavior.
How AI Can Enhance Your Understanding
AI can be useful here, but only if you think of it as an assistant, not an authority.
Parents already do intense pattern recognition. You remember the bad night, the skipped lunch, the rough car ride, the explosive evening. The problem isn't care. It's bandwidth. There's too much detail for one person to hold.
AI can reduce the burden of logging
The first job AI can do well is make data capture easier. That matters because the best observations often happen in motion, while you're regulating a child, driving, cleaning up, or moving to the next task.
Voice logging is a good example. Speaking a quick note preserves details that would otherwise disappear. It also lowers the barrier to consistency, which is often the hardest part of behavioral data analysis at home.
AI can surface subtle patterns
The second job is pattern support. AI is good at scanning many entries and noticing combinations a busy parent might not catch, especially when the trigger and the outcome aren't close together.
For example, you might notice loud settings and distress on the same day. AI may help you also notice that poor sleep, a change in diet, and a packed schedule formed the background pattern across several similar days. That doesn't replace your judgment. It gives you more to consider.
Research in classroom settings shows that explainable AI models trained on video-based behavioral data can detect episodes of problem behaviors with a 77% F1-score, without relying on manual staff input (explainable AI for detecting problem behaviors). That doesn't mean AI understands your child better than you do. It does show that AI can assist with recognizing complex behavioral signals.
Keep AI in its proper role
Use AI well by giving it a support role:
- Capture details quickly when typing feels unrealistic
- Organize repeated entries into themes you can review
- Flag unusual changes so you know where to look closer
- Prompt better questions for your next therapy or pediatric visit
AI is most helpful when it stays explainable. If a suggestion doesn't make sense to you, it shouldn't automatically shape a care decision. Parents need tools that clarify, not mystify.
Good AI doesn't tell you what your child means. It helps you see what you may want to examine more closely.
Sharing Data Ethically with Your Care Team
Behavioral data becomes more useful when the people supporting your child can work from the same picture.
That includes parents, grandparents, teachers, therapists, aides, and medical professionals. But sharing doesn't mean sending every raw detail to everyone. Ethical sharing starts with relevance, privacy, and clarity.
Share the minimum that helps
A teacher may need to know when transitions are hardest and what support reduces distress. A therapist may need a behavior timeline with triggers and consequences. A pediatrician may need a broader summary that includes sleep, medication, and behavior changes.
That's why selective sharing works better than information dumping.
Use these filters before you share:
- Purpose to decide why this person needs the information
- Scope to decide how much detail is necessary
- Timing to decide whether live updates or periodic summaries make more sense
- Privacy to remove details that aren't needed for the decision at hand
Turn logs into useful conversations
Raw notes can overwhelm a meeting. A summary creates traction.
Bring a short report that answers practical questions:
| Care team member | Most useful data |
|---|---|
| Teacher | Time of day, transition triggers, helpful supports |
| Therapist | A-B-C patterns, intensity, recovery, repeated contexts |
| Doctor | Sleep, behavior shifts, medications, major routine changes |
This approach also supports broader goals around accessibility in healthcare, because information is more helpful when it's organized, readable, and easy for different people to use.
A focused set of ABA session notes for collaboration can help families translate everyday events into something a care team can review consistently.
Protect trust while staying coordinated
Families often struggle with a real tension here. They want everyone aligned, but they don't want private details spread loosely across texts, notebooks, and email chains.
A strong ethical standard is simple. Share what helps your child receive better support, and no more than that. If multiple caregivers are involved, agree on where information lives, who can see it, and what kind of updates belong in that shared record.
Clear boundaries make collaboration safer and more useful.
Putting Your Data into Action with Guiding Growth
The point of behavioral data analysis isn't better note-taking. It's better decisions.
When you collect observations consistently, measure what matters, and look for patterns over time, the day starts to feel less random. You may not control every hard moment, but you can respond with more confidence because you're no longer working from fragments.
Build a practical routine
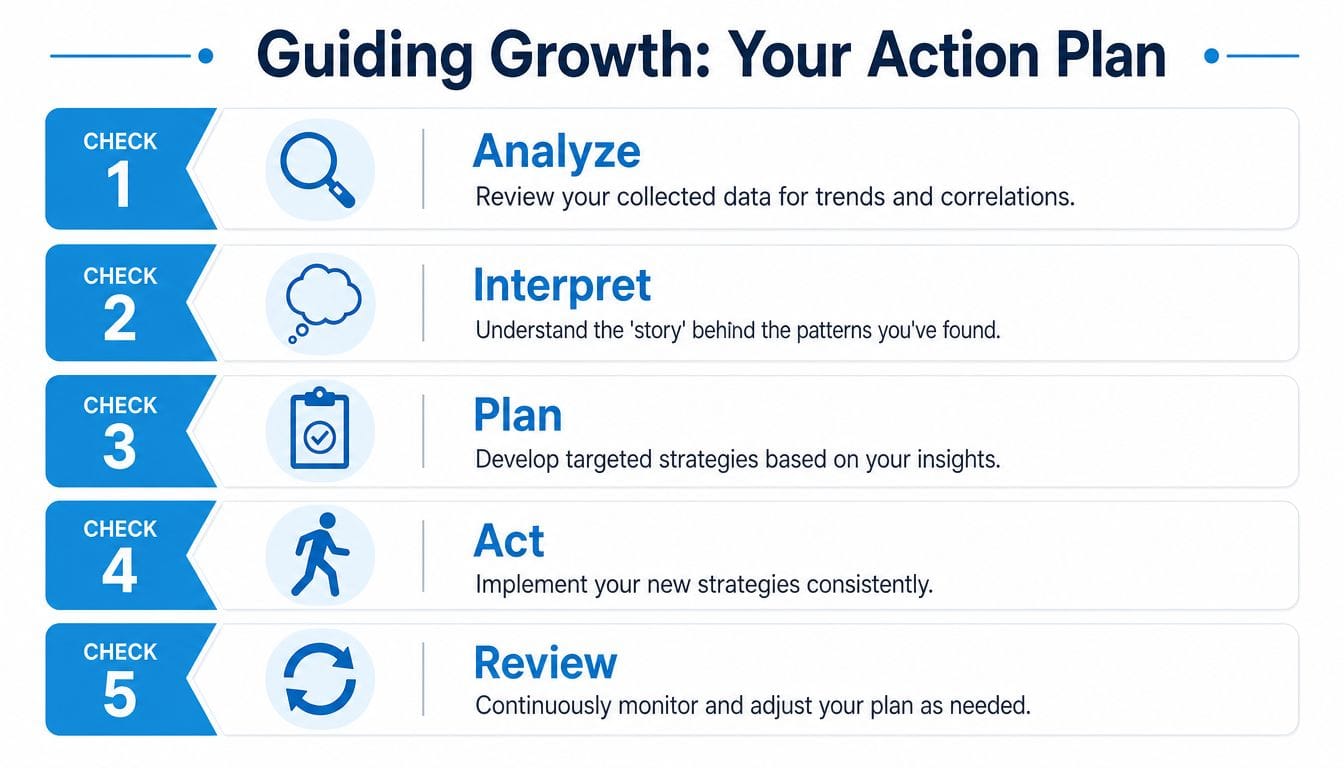
A sustainable routine usually looks like this:
Log one meaningful behavior consistently
Pick a behavior that affects daily life and record it the same way each time.Add a few context clues
Include time, setting, likely trigger, and what happened after.Review at regular intervals
Look back for timing, repetition, and changes in intensity or duration.Adjust one support at a time
Change one part of the routine so you can tell what helped.Share the summary when needed
Bring patterns, not just anecdotes, into appointments and school conversations.
Why combined data matters
Behavior rarely exists in isolation. Sleep affects regulation. Food can affect comfort. Environment changes demands. Therapy schedules shape energy and recovery. That's why combined records are often more informative than isolated notes.
Research on autism detection found 97.57% accuracy when multi-modal visual and behavioral datasets were integrated, showing the value of combining different data streams rather than relying on one kind of observation alone (multi-modal behavioral data and autism detection).
For families, the lesson is practical. The more connected your records are, behavior, routines, health details, and context, the easier it becomes to see the full picture.
Behavioral data analysis doesn't ask you to become clinical or detached. It asks you to become more observant in a way that protects your energy and supports your child with less guesswork.
If you want one place to log behaviors, track patterns, organize care details, and share clear summaries with the people supporting your child, Guiding Growth gives you a simple way to start. It helps turn everyday observations into structured insight so you can understand what's changing, what's helping, and what to try next.